Machine learning uses statistics to find patterns in data, and then applies those patterns to act on new data. It is the driving force behind many Internet services. For example, machine learning could figure out the kind of food you like based on your personal history, and then recommend related restaurants to you. Machine learning is both computationally intensive and time sensitive, performance matters.
The lingua franca of machine learning is Python. However, Python itself is actually quite slow in computationally intensive algorithms. Rust could be 25x faster than Python for machine learning. Under the hood, Python relies on C/C++ based native modules to do the heavy lifting. Serious machine learning developers still need to know C/C++. Furthermore, the lingua franca of the web is JavaScript. In order to incorporate machine learning in web applications, we need a high performance and safe solution that works seamlessly with JavaScript, or Node.js in particular. That is a lot of complexity and often results in poor performance.
For web-based machine learning applications, a streamlined software stack based on Rust, WebAssembly, and Node.js makes a lot of sense. Rust allows us to write high performance machine learning functions. Those Rust functions can be compiled into WebAssembly bytecode for runtime safety, cross-platform portability, and capability-based security. Developers can then access those functions from an easy-to-use JavaScript API in the Node.js environment. In the getting started with Rust functions in Node.js, we showed you how to compile Rust functions into WebAssembly, and call them from Node.js applications. In this example, we will demonstrate two important machine learning tasks in Rust.
- First, we show you how to find clusters in a set of points. Clustering is one of the most common data patterns. For example, your favorate foods show up as clsuters in a diagram of dishes you eat every day. The k-means clustering a popular algorithm to find clusters in arbitory data.
- Then, we will plot the input data and the computed cluster centers in a SVG graph (credit: this technique is first discussed by Cetra in this article). The visualization of data is a key part of machine learning.
The example source code for this tutorial is here.
Prerequisites
Check out the complete setup instructions for Rust functions in Node.js.
Rust function for k-means clustering
The Rust function fit() is as follows. It reads the coordinates of a set of points from a CSV data file, and groups the points into clusters based on the number of estimated clusters. The cluster centers are returned as a Vec<f64> in the format of [center1.x, center1.y, center2.x, center2.y, ... centerN.x, centerN.y].
use wasm_bindgen::prelude::*;
use ndarray::{Array2};
use std::str::FromStr;

pub fn fit (csv_content: &[u8], num_clusters: usize) -> Vec<f64> {
    let data: Vec<f64> = read_data(csv_content);
    let arr = Array2::from_shape_vec((data.len() / 2, 2), data).unwrap();
    let (means, _clusters) = rkm::kmeans_lloyd(&arr.view(), num_clusters);

    let mut serialized_vec : Vec<f64> = Vec::new();
    for row in means.genrows() {
      serialized_vec.push(row[0]);
      serialized_vec.push(row[1]);
    }
    return serialized_vec;
}
Rust function to draw SVG
The Graph struct provides functions to draw the data points and the computed center points in an SVG template file graph.svg. The template file is loaded to the Rust program at compile time.
impl Graph {
pub fn draw_svg(&self, width: usize, height: usize, padding: usize, path: Vec<Point>, centers: Vec<(f64, f64)>) -> String {
let mut context = Context::new();
let mut p: Vec<(f64, f64)> = Vec::new();
for point in path {
p.push((point.x, point.y));
}
context.insert("name", &self.name);
context.insert("width", &width);
context.insert("height", &height);
context.insert("padding", &padding);
context.insert("path", &p);
context.insert("centers", ¢ers);
context.insert("max_x", &self.max_x);
context.insert("max_y", &self.max_y);
context.insert("colour", &self.colour);
context.insert("lines", &5);
Tera::one_off(include_str!("graph.svg"), &context, true).expect("Could not draw graph")
}
}
Rust function for Node.js
The fit_draw function takes in the content of the CSV file. It calls the fit function to compute the cluster centers, and then the draw_svg function creates the SVG document in the form of a string.
#[wasm_bindgen]
pub fn fit_draw (csv_content: &[u8], num_clusters: usize, width: usize, height: usize, padding: usize, title: &str) -> String {

  ... ...
  let center_arr: Vec<f64> = fit (csv_content, num_clusters);
  ... ...

  let out = graph.draw_svg(width, height, padding, path, centers);
  return out;
}
The web app
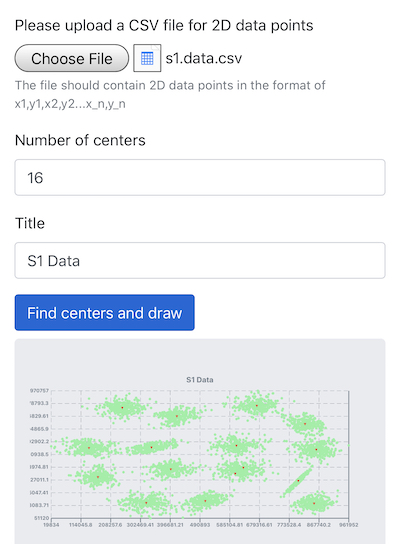
The following HTML file shows the web form for uploading a CSV data file. The jQuery ajaxForm function uploads the data to the /draw URL and writes any response into svg_img element the page.
<html lang="en">
    ... ...
    <script>
    $(function() {
        var options = {
          target: '#svg_img',
          url: "/draw",
          type: "post"
        };
        $('#draw').ajaxForm(options);
    });
    </script>
    ... ...
    <form id="draw" enctype="multipart/form-data">
	    <div class="form-group">
          <label for="csv_file">Please upload a CSV file for 2D data points</label>
          <input type="file" class="form-control-file" id="csv_file" name="csv_file">
	      <small id="csv_help" class="form-text text-muted">The file should contain 2D data points in the format of x1,y1,x2,y2...x_n,y_n</small>
        </div>

	    <div class="form-group">
          <label for="num">Number of centers</label>
          <input type="number" class="form-control" id="num" name="num" value="3">
        </div>

        <div class="form-group">
          <label for="title">Title</label>
          <input type="text" class="form-control" id="title" name="title" value="Demo">
        </div>

        <button type="submit" class="btn btn-primary mb-2">Find centers and draw</button>
      </form>

      <div class="jumbotron">
        <p id="svg_img" class="lead">Upload a CSV data file and press the button above!</p>
      </div>
    </form>
    ... ...
</html>
Node.js function
The Node.js listner at the /draw endpoint receives the CSV data, calls the Rust function to process and plot the points, and returns the SVG back to the web page for the svg_img element.
const { fit_draw } = require('../pkg/ml_lib.js');

app.post('/draw', function (req, res) {
  let csv_file = req.files.csv_file;
  var svg = fit_draw(csv_file.data, parseInt(req.body.num), 800, 400, 50, req.body.title);
  res.send(svg)
})
Build and run
Build and run the Node.js application.
$ ssvmup build
$ cd node
$ node server.js
You can now point your browser to http://localhost:8080 and upload an example CSV file to see for yourself!